
RESEARCH ARTICLE
Comparison of the Demographics, Clinical Presentations, Seasonality, and Outcome between Adult Patients with Influenza A and B in Two Seasons (2014-2015 and 2015-2016) with Emphasis on H1N1 Infection Outcome
Abdalla Khalil1, *
Article Information

Identifiers and Pagination:
Year: 2019Volume: 11
First Page: 43
Last Page: 51
Publisher ID: TOIDJ-11-43
DOI: 10.2174/1874279301911010043
Article History:
Received Date: 02/10/2019Revision Received Date: 17/10/2019
Acceptance Date: 20/11/2019
Electronic publication date: 31/12/2019
Collection year: 2019

open-access license: This is an open access article distributed under the terms of the Creative Commons Attribution 4.0 International Public License (CC-BY 4.0), a copy of which is available at: https://creativecommons.org/licenses/by/4.0/legalcode. This license permits unrestricted use, distribution, and reproduction in any medium, provided the original author and source are credited.
Abstract
Background:
Studies comparing Influenza A and B in our community are extremely limited.
Methods:
Adult patients (n=1708) with ILI who visited the outpatient clinics or emergency department with FIA-positive nasal swab in two seasons were included in the analysis.
Data on demographics, clinical presentation, comorbidities, and prolonged illness (revisit after 48 hours with same presentation and no admission), hospital admissions, death, and LOS were collected.
Data on patients tested for H1N1 (309) by Cepheid Xpert Flu Assay (H1N1 positive, 143 [46%]; H1N1 negative, 166 [54%]) were also collected.
Results:
Prolonged illness was more frequent in patients with influenza B than those with influenza A (15.21% and 10.18%, respectively; P=0.002).
There was no significant difference in frequency of total admissions, medical unit or intensive care unit admissions, LOS, and death between patients with influenza A and B.
Total admissions were more frequent in H1N1-positive patients than H1N1-negative patients (23.1% and 13.3%, respectively; P=0.024).
Prolonged illness was more frequent in H1N1-positive patients (23.1%) than H1N1-negative patients (4.8%) (P < 0.001).
There was no statistically significant difference in admission to the medical unit or ICU, death, and LOS between H1N1-positive and H1N1-negative patients.
The peak months of influenza A were December in the first season and October in the second season. April was the peak month of influenza B in both seasons.
There was no statistically significant difference in the outcome of pregnant patients with influenza (either A or B) compared to non-pregnant women with influenza within the same childbearing age (maternal outcome was not studied).
Conclusion:
Prolonged illness was more frequent in flu B than in flu A patients.
Patients with positive H1N1 had more frequent prolonged illness, and total hospital admissions than those with H1N1-negative patients.
There was a different peak month(s) of patients with flu A compared to flu B.
1. INTRODUCTION
Infection due to influenza B virus was considered to be milder than influenza A virus infection and carry less burden, which was proven incorrect by studies conducted in the last two decades [1].
Studies have shown similar clinical presentation between patients infected with seasonal influenza A and B virus in outpatient clinics [2, 3]. A higher mortality rate was noted in pediatric patients with influenza B infection [4]. Other studies have suggested that oseltamivir may be less effective in reducing fever in outpatients infected with influenza B virus compared to those infected with influenza A virus [5].
In the United States, the flu season is usually between the months of October and May. It usually peaks in February [6]. In Australia, the flu season is between the months of May and October and usually peaks in August [7].
During a 34-year period (1982-1983 to 2015–2016) in the USA, the peak month of flu activation was most often in February (14 seasons), followed by December (7 seasons), March (6 seasons), and January (5 seasons) [6].
In our search, we could not find a study discussing a similar comparison of demographics, clinical presentation, outcome, and seasonality on influenza infection in our community.
1.1. Aim and Objectives
This study aimed to analyze the following:
(1) Difference between influenza A and B with respect to demographics, clinical presentations, and outcome.
(2) Difference between Flu A H1N1 polymerase chain reaction (PCR)-positive patients and H1N1 PCR-negative patients with respect to the abovementioned variables.
(3) Difference in seasonality (peak month of cases) between influenza A and B
(4) Outcome in pregnant women with influenza compared to that in non-pregnant women with influenza within the same childbearing age (not maternal outcome).
2. MATERIALS AND METHODS
The case definition of influenza-like illness (ILI) by the European Centre for Disease Prevention and Control (ECDC) was used in our study. ILI was defined as a sudden onset of one of the following symptoms: fever ≥ 37.8°C, headache, malaise, and myalgia combined with respiratory symptoms, such as cough, sore throat, or shortness of breath [8].
Retrospectively, we reviewed all electronic files of adult patients (> 14 years) who visited the outpatient department (including family medicine clinics) or emergency department (ED) of the International Medical Center with ILI and underwent a rapid influenza diagnostic test (RIDT)–fluorescent immunoassay (FIA) (Sofia Influenza A + B system) nasal swab in two seasons (2014–2015 and 2015–2016). The exclusion criteria were negative RIDT and age < 14 years (age for admission to the adult medical unit).
Data of all adult patients with positive RIDT were collected, which included age, sex, comorbidities (cardiac, respiratory, chronic kidney disease, and diabetes mellitus), main clinical presentation (mainly respiratory or gastrointestinal complaints or a combination of both), pregnancy status (at the childbearing age [CBA], 16–50 years), prolonged illness (defined as returning to the healthcare facility after > 48 h with the same complaint and did not require hospital admission), patient outcome (admission to the medical unit or Intensive Care Unit [ICU] and death), positive radiological findings of pneumonia or bronchopneumonia (as reported by our radiologists), and Length of Hospital Stay (LOS).
We compared findings between patients with influenza A and influenza B with all the abovementioned parameters.
RIDT nasal swabs were ordered according to the physician's clinical assessment and ECDC definition. Patients were divided into four age groups: 14–25 years, > 25–40 years, > 40–65 years, and > 65 years.
The main presenting symptoms were divided into either respiratory symptoms alone, gastrointestinal symptoms alone, or a combination of both. Respiratory symptoms were symptoms other than those observed in patients with ILI based on the ECDC definition, i.e., expectoration, wheezing, chest pain, or hemoptysis. Gastrointestinal symptoms included nausea, vomiting, anorexia, abdominal pain, and diarrhea.
Data of patients with positive RIDT for influenza A who were tested using the Cepheid Xpert Flu Assay multiplexed PCR for rapid identification of influenza A H1N1 were also reviewed (n = 309). The outcome of the H1N1 PCR-positive patients was compared to that of the H1N1 PCR-negative patients.
The outcome of pregnant women with influenza (either A or B) was also compared to that of non-pregnant women with influenza within the CBA (16-50 years).
The Sofia Influenza A + B system nasal swab showed sensitivities in relative real-time PCR results of 74.2% for influenza A and 82.5% for influenza B. It showed the specificity of 100% for both influenza A and B in the same real-time PCR [9].
The results of the Sofia Influenza A + B FIA patients with ILI at clinics in the USA-Mexico border in the two seasons were compared with those of real-time reverse transcription PCR. The overall sensitivities and specificities were 83% and 81% for influenza A and 62% and 93% for influenza B, respectively [10].
Compared to viral cultures, Cepheid Xpert Flu Assay for rapid PCR identification of influenza A 2009 H1N1 showed a sensitivity and specificity of 100% [11].
2.1. Limitation in the Study
The limited number of ordered H1N1 PCR by Cepheid Xpert Flu assays in this retrospective study was mainly due to the longer time required for the result to be available at our laboratory (> 3 h for H1N1 PCR but < 1 h for RDIT).
2.2. Statistical Analysis
Analysis of data was performed using SPSS 21 for Windows. Numerical data were not normally distributed. Accordingly, the Mann-Whitney U test was used to compare independent variables between the two groups. A comparison between categorical variables was conducted using the chi-square test (X2). The binary correlation was performed using the Spearman correlation test. Multivariate analysis using logistic regression was conducted to determine possible predictors for hospital admission of cases. The odds ratio with a 95% confidence interval was calculated. A P-value ≤ 0.05 indicated statistical significance.
3. RESULTS
Of 8667 patients tested for influenza using RDIT nasal swab in two seasons (2014-2015 and 2015-2016), 1708 (20%) showed positive results. Of the same patients tested for influenza, 992 (11.5%) were positive for influenza A, 697 (8.0%) for influenza B, and 19 (0.2%) for co-infection of influenza A and B.
The highest percentage of patients with positive results was noted in the months of October, November, and December (23%–29%) in both the seasons and March, April, and May in the second season only (21%–30%).
The lowest percentage of positively tested patients was noted in the months of August and September (5-10%) in both the seasons.
3.1. Comparison of Demographic Data and Main Clinical Presentation
In the 14–25-year group, there were more patients with influenza B compared to those with influenza A (22.53% and 16.43%, respectively; P = 0.017).
The median age of men with influenza B was also lower (younger age) than that of men with influenza A (34 and 36 years, respectively; P = 0.001) (Table 1). There was no significant difference in sex between patients with influenza A and B (Table 1, Fig. 1).
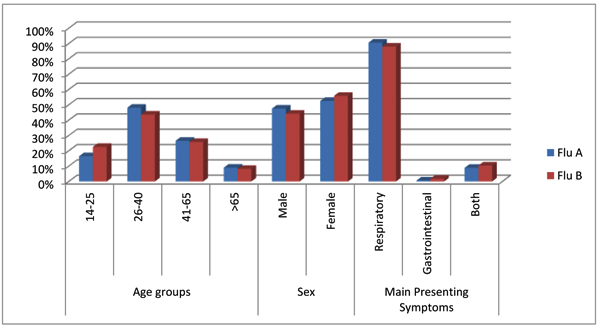 |
Fig. (1). Demographic characteristics (age groups and gender) and clinical presentation percentage among patients infected with influenza A and influenza B during the 2 seasons (2014-2015 and 2015-2016). |
| – | Flu A | Flu B | P Value | |||
|---|---|---|---|---|---|---|
| n. | % | n. | % | |||
| Age groups | 14-25 | 163 | 16.43 | 157 | 22.53 | 0.017 |
| 26-40 | 477 | 48.08 | 304 | 43.62 | ||
| 41-65 | 263 | 26.51 | 179 | 25.68 | ||
| >65 | 89 | 8.97 | 57 | 8.18 | ||
| Age Median in years (25th P-75th P ) |
Male | 36.0 (30.0-52.0) | 34.0 (24.0-48.0) | 0.001 | ||
| Female | 34.0 (27.5-48.0) | 34.0 (27.5-49.5) | 0.792 | |||
| Sex | Male | 471 | 47.48 | 308 | 44.19 | 0.182 |
| Female | 521 | 52.52 | 389 | 55.81 | ||
| Main Presenting Symptoms | Respiratory | 898 | 90.52 | 613 | 87.95 | 0.049 |
| Gastrointestinal | 6 | 0.60 | 12 | 1.72 | ||
| Both | 88 | 8.87 | 72 | 10.33 | ||
| Comorbidities | Respiratory Diseases | 95 | 9.58 | 61 | 8.75 | 0.564 |
| Cardiac Diseases | 49 | 4.94 | 30 | 4.30 | 0.543 | |
| Diabetes Mellitus | 118 | 11.90 | 69 | 9.90 | 0.198 | |
| Chronic Kidney Disease | 5 | 0.50 | 3 | 0.43 | 0.828 | |
| Pregnancy (among CBA 14-50 years) | Negative | 360 | 82.38 | 271 | 85.23 | 0.335 |
| Positive | 77 | 17.62 | 47 | 14.77 | ||
| Prolonged illness | 101 | 10.18 | 106 | 15.21 | 0.002 | |
| Radiological findings | 65 | 6.55 | 33 | 4.73 | 0.116 | |
| Admission | Total | 72 | 7.26 | 49 | 7.03 | 0.858 |
| Medical | 67 | 6.8 | 47 | 6.7 | 0.79 | |
| ICU | 5 | 0.5 | 2 | 0.3 | ||
| Death | 1 | 0.10 | 2 | 0.29 | 0.371 | |
| Length of stay LOS Median days (25th P-75th P ) |
3.0 (2.0-4.0) |
3.0 (2.0-4.0) |
0.850 | |||
Respiratory symptoms were the most common presenting symptoms in patients with influenza A and those with influenza B (90.5% and 87.9%, respectively). Gastrointestinal symptoms and a combination of gastrointestinal and respiratory symptoms were more frequent in patients with influenza B (1.72% and 10.33%, respectively) compared to those with influenza A (0.60% and 8.87%, respectively) (P = 0.049) (Table 1, Fig. 1).
There was no statistically significant difference in the percentage of patients with comorbidities (respiratory, cardiac, and chronic kidney diseases or diabetes mellitus) in both the groups.
The difference in radiological findings of pneumonia or bronchopneumonia between the two groups was not statistically significant.
Of women within the CBA with either type of influenza (755 patients), 631 were not pregnant, and 124 were pregnant (Tables 1 and 3).
Of 437 female patients within the CBA who had influenza A infection, 360 (82.38%) were not pregnant, and 77 (17.62%) were pregnant. Of 318 female patients within the CBA who had influenza B infection, 271 (85.23%) were not pregnant, and 47 (14.77%) were pregnant.
There was no statistical difference in the number of female patients within the CBA (pregnant and non-pregnant) between patients with influenza A and B (Table 1).
3.2. Comparison of Outcomes between Patients with Influenza A and B
Prolonged illness (persistent symptoms with a revisit to a clinic or ED after ≥ 48 h and not requiring admission, i.e., more sick days off) was more frequent in patients with influenza B (15.21%) compared to those with influenza A (10.18%) (P = 0.002) (Table 1).
There was no significant difference in the frequency of total admissions and medical unit or ICU admissions in patients with influenza A and B.
The mortality rate did not differ between patients with influenza A and B.
LOS of admitted patients in both the groups (median days, 25th–75th percentile) was equal (3.0 days; 25th–75th percentile, 2.0–4.0 days).
3.3. Seasonality of Influenza A and B
Two different peak months for influenza A and B were noted in the two seasons (2014–2015 and 2015–2016) (Fig. 2).
The peak month of influenza A activity was December in the first season (108 patients) and October in the second season (148 patients).
The peak month of influenza B activity was April in the first and second seasons (38 and 138 patients, respectively) (Fig. 2).
Co-infection of influenza A and B was noted in 19 patients and studied separately from the comparison of influenza A and B.
Only one (5.2%) of the 19 patients with co-infection was immunocompromised (with rheumatoid arthritis on steroids and azathioprine). The remaining patients (18, 94.8%) were immunocompetent. Four patients had prolonged illness (21%), while three patients required admission: two to the medical unit (11%) and one (5%) to the ICU with mean LOS of 4 days and no death reported. These percentages of prolonged illness and admission to the medical unit or ICU were higher compared to the outcome in influenza A or B alone. Meanwhile, the number of patients was too small in the co-infection group.
3.4. Comparison between H1N1 PCR-positive Patients and H1N1 PCR-negative Patients
Of 992 patients with influenza A, 309 were tested using Cepheid Xpert Flu Assay nasopharyngeal swabs for H1N1 strain in the two seasons (2014-2015 and 2015-2016). Of the tested group, 166 patients were H1N1 negative, and 143 were H1N1 positive.
There were 136 patients tested in the first season (2014-2015) and 173 patients tested in the second season (2015-2016).
In the first season, 18 (13.2%) patients with influenza A were positive for H1N1, while, in the second season, 125 (72.3%) patients were H1N1 positive.
Prolonged illness was more frequent in H1N1-positive patients (23.1%) compared to H1N1-negative patients (4.8%) (P < 0.001) (Table 2, Fig. 3).
Total hospital admissions were more frequent in H1N1-positive patients (23.1%) compared to H1N1-negative patients (13.3%) (P = 0.024) (Table 2, Fig. 3).
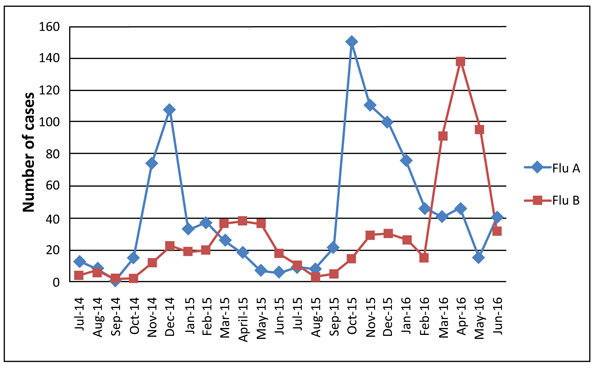 |
Fig. (2). Number of Flu A and Flu B positive patients detected monthly during the two seasons (2014-2015 and 2015-2016). |
| – |
H1N1 Negative n.=166 |
H1N1 Positive n.=143 |
P Value | |||
| n. | % | n. | % | |||
| Sex | Male | 79 | 47.6 | 66 | 46.2 | 0.801 |
| Female | 87 | 52.4 | 77 | 53.8 | ||
| Age Median in years (25th P-75th P ) |
– | 35.00 (27.00-53.25) | 35.00 (30.00-52.00) | – | ||
| Main Symptoms | Respiratory | 156 | 94.0 | 127 | 88.8 | 0.139 |
| GI | 0 | 0.0 | 2 | 1.4 | ||
| Both | 10 | 6.0 | 14 | 9.8 | ||
| Comorbidities | Respiratory | 18 | 10.8 | 26 | 18.2 | 0.066 |
| Cardiac | 10 | 6.0 | 12 | 8.4 | 0.420 | |
| DM | 20 | 12.0 | 24 | 16.8 | 0.235 | |
| CRF | 1 | 0.6 | 1 | 0.7 | 0.916 | |
| Pregnancy | Negative | 55 | 80.9 | 50 | 80.6 | 0.973 |
| Positive | 13 | 19.1 | 12 | 19.4 | ||
| Prolonged Illness | 8 | 4.8 | 33 | 23.1 | <.001 | |
| Radiological finding | 12 | 7.2 | 17 | 11.9 | 0.161 | |
| Admission | Total | 22 | 13.3 | 33 | 23.1 | 0.024 |
| Medical | 20 | 12.0 | 29 | 20.3 | 0.075 | |
| ICU | 2 | 1.2 | 4 | 2.8 | ||
| Death | 0 | 0.0 | 1 | 0.7% | 0.281 | |
| Length of stay LOS Median days (25th P-75th P ) |
3.00 (2.00-4.00) |
3.00 (2.00-6.50) | 0.146 | |||
| – |
Non Pregnant n.=631 |
Pregnant n.=124 |
P Value | |||
| n. | % | n. | % | |||
| Main symptoms | Respiratory | 551 | 87.3 | 111 | 89.5 | 0.503 |
| GI | 10 | 1.6 | 3 | 2.4 | ||
| Both | 70 | 11.1 | 10 | 8.1 | ||
| Comorbidities | Respiratory | 44 | 7.0 | 4 | 3.2 | 0.118 |
| Cardiac | 3 | 0.5 | 0 | 0.0 | 0.442 | |
| DM | 28 | 4.4 | 2 | 1.6 | 0.141 | |
| CRF | 1 | 0.2 | 0 | 0.0 | 0.657 | |
| Prolonged illness | 73 | 11.6 | 17 | 13.7 | 0.501 | |
| Radiological finding | 21 | 3.3 | 0 | 0.0 | 0.039 | |
| Admission | Total | 33 | 5.2 | 5 | 4.0 | 0.577 |
| Medical | 33 | 5.2 | 5 | 4.0 | 0.577 | |
| ICU | 0 | 0.0 | 0 | 0.0 | ||
| Death | 1 | 0.2 | 0 | 0.0 | 0.657 | |
| Length of stay LOS Median days (25th P-75th P ) |
3.0 (2.0-3.0) | 3.0 (2.5-5.0) | 0.376 | |||
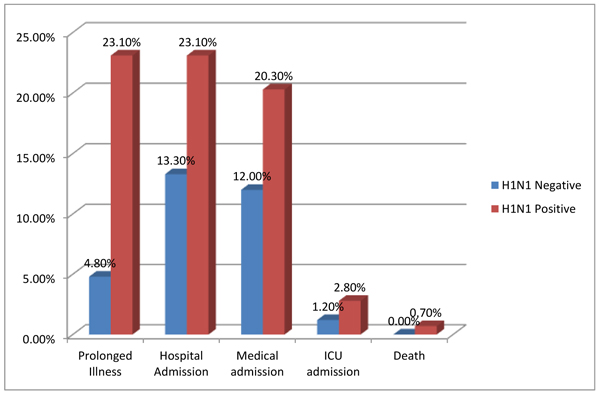 |
Fig. (3). Comparison between Flu A with H1N1 PCR positive and negative patients, regarding prolonged illness, total hospital admission, medical unit admission, ICU admission and death. |
Comparing the data separately, admission to the medical unit alone, ICU admission alone, radiological findings of chest infection, and death were more frequent in the H1N1-positive group, but the difference was not statistically significant (Table 2).
The median LOS was equal in both the groups: 3.00 days with 25th–75th percentile of 2.00-6.50 days in the H1N1-positive group and 2.00-4.00 days in the H1N1-negative group (Table 2).
3.5. The outcome in pregnant women with influenza compared to non-pregnant women with influenza within the CBA (16-50 years)
The total number of women within the CBA with influenza (A or B) in our study was 755. Of these, 631 were not pregnant, and 124 were pregnant.
The differences in the frequency of prolonged illness, total admission, admission to the medical unit, ICU admission, death, and LOS were not statistically significant between the two groups (Table 3).
Meanwhile, comorbidities (respiratory, cardiac, and chronic kidney diseases and diabetes mellitus) were more frequent in the non-pregnant group, but there was no statistically significant difference.
Maternal outcome (premature delivery, miscarriage, intrauterine fetal death, etc.) in pregnant women with influenza (A or B) compared to those in pregnant patients without influenza was not analyzed in our study and is a potential topic in a separate publication.
4. DISCUSSION
4.1. Main Clinical Presentation
In a systematic review and meta-analysis in France regarding the prevalence of gastrointestinal symptoms in influenza, 44 studies were included. The pooled prevalence rates of any gastrointestinal symptoms were 2.8% for influenza A H1N1, 28.6% for influenza B, and 24.2% for influenza A H3N2 [12].
The pooled prevalence rate of influenza viruses in stool was 20.6%. The most commonly reported symptom in the same study was vomiting, with pooled proportions ranging from 25.3% for influenza B virus infection to 21.9% for influenza A (H3N2) virus infection [12].
In our data, solitary gastrointestinal symptoms and the combination of gastrointestinal and respiratory symptoms were more frequent in patients with influenza B (1.72% and 10.33%, respectively) compared to those with influenza A (0.6% and 8.8%, respectively) (P = 0.049).
4.2. Seasonality and Peak Month of Influenza A and B
Both the Center for Disease Control and Prevention (CDC), and World Health Organization (WHO) did not reveal a difference in influenza season or peak month of recorded patients between influenza A and B [6].
Two korean studies compared clinical and epidemiological characteristics of influenza A and B in adult and pediatric patients in the season of 2011-2012 over a 20-week period (October 2011 to May 2012). Both the studies showed a different peak week of cases between influenza A and B.
The first study discussed the epidemiological characteristics of influenza A (H3N2, the predominant strain in that season) and B in adult patients in multiple centers.
In the 20 weeks of the study from October until May, the peak week of influenza A (H3N2 strain) was the third week, and that of influenza B, it was the 13th week [13].
The second Korean study reported the clinical manifestations of influenza A and B in pediatric and adult patients at a tertiary care hospital for 20 weeks in the same season (October 2011 to May 2012).
The peak week of influenza A in both adult and pediatric patients was the fourth week, while the peak weeks for influenza B were the 12th week in pediatric patients and 14th week in adult patients [14].
This difference between the peak weeks of influenza A and B in the Korean studies is similar to the difference between the peak months of influenza A and B in our findings.
Meanwhile, the Korean studies used one season 2011-2012 only for adult and pediatric patients, and our data related to adult patients were obtained in two seasons (2014-2015 and 2015-2016).
4.3. Comparison between H1N1 PCR-positive patients and H1N1 PCR-negative Patients
In a study about Influenza research in the Eastern Mediterranean Region (23 countries including Saudi Arabia), the predominant Influenza A subtype during 53 weeks of 2014 was A (H3), and the predominant A subtype during the first 30 weeks of 2015 was A(H1N1)pdm09 [15].
Of the tested group with flu A for H1N1 PCR in our study (309), 166 patients were H1N1 negative, and 143 were H1N1 positive.
There were 136 patients tested in the first season (2014–2015) and 173 patients tested in the second season (2015–2016).
In the first season, 18 (13.2%) patients with influenza A were positive for H1N1, while, in the second season, 125 (72.3%) patients were H1N1 positive.
These findings of the predominant A (H1N1) subtype in the second season of our study correlate with the Eastern Mediterranean Region study [15].
In a study in the northern province of Saudi Arabia, conducted for one year (January 2015 to December 2015), of 300 patients with ILI, 54 (18%) were H1N1 positive.
Of the H1N1-positive patients, 8 (14.8%) developed pneumonia, 5 (9.3%) developed adult respiratory distress syndrome, 15 (27.8%) required ICU admission, and 9 (16.6%) required mechanical ventilation. This study involved both adult and pediatric patients, and no comparison with the H1N1-negative patients was noted [16].
Another older study was performed for 6 months at a general hospital in the eastern province of the Kingdom (July to December 2009 pandemic), of 165 patients admitted with ILI, 47 (28%) were confirmed to have novel H1N1 virus infection.
The frequency of pneumonia on chest X-ray interpretation, ICU admission, intubation, and LOS in H1N1-positive patients was not statistically significantly different compared to that in H1N1-negative patients. These findings are similar to those of our study.
The average LOS was 8.2 days in H1N1-positive patients and 7.5 days in H1N1-negative patients, with no statistically significant difference [17]. This LOS was longer compared to the median LOS in our study (3.0 days).
4.4. The Outcome in Pregnant Women Infected with Influenza Virus
Few studies showed a higher risk of hospitalization, ICU admission, and maternal death in pregnant women with influenza [18, 19].
In our study, no significant difference in the frequency of prolonged illness, total hospital admissions, admission to the medical unit, ICU admissions, death, or LOS was noted between pregnant women with influenza compared to non-pregnant women with influenza within the same CBA.
We did not evaluate the maternal outcome (i.e., premature delivery, miscarriage, intrauterine fetal death, etc.) of pregnant women with influenza compared to pregnant women without influenza, which is a potential topic for a separate study.
4.5. Co-infection
Co-infection of influenza A and B has been rarely reported in immunocompromised patients, such as those with leukemia [20]. In France, dual respiratory infections by influenza viruses were detected in 3 (3.2%) of 93 influenza-positive patients, including two cases of infection by influenza A/H3N2 and B viruses and one case of dual infection by influenza A/H3N2 and A/H1N1 viruses [21].
In the UK, co-infection between seasonal influenza A and influenza B viruses was associated with a significant increase in the risk of admission to the ICU or death [22].
In our study, a small number of patients had co-infection of influenza A and B (19 patients only compared to 992 patients with influenza A and 717 patients with influenza B). Similarly, a high frequency of prolonged illness, medical unit admission, and ICU admission (21%, 10.5%, and 5%, respectively) was also noted in this group of patients in our study. The mean LOS was 4 days, and no death was reported.
CONCLUSION
There was no statistically significant difference noted between patients with influenza A and B with respect to total admission to the hospital, admission to the medical unit, ICU admission, death, or LOS.
Patients with influenza B more frequently had prolonged illness (revisit to OPD or ED with the same complaints after 48 h but not requiring admission) compared to patients with influenza A (15.21% and 10.18%, respectively; P = 0.002).
Patients with influenza A with positive H1N1 PCR more frequently had prolonged illness and total hospital admission compared to H1N1-negative patients (prolonged illness, 23.1% and 4.8%, respectively, P < 0.001; total hospital admission, 23.1% and 13.3%, respectively; P = 0.024).
There was no significant difference in the outcome of pregnant women with influenza (either A or B) compared to that in non-pregnant women with influenza within the CBA (maternity outcome was not included in our study).
The peak months of the activity of influenza A were December in the first season (2014–2015) and October in the second season (2015–2016). The peak month of the activity of influenza B was April in both the seasons.
LIST OF ABBREVIATIONS
| ED | = Emergency Department |
| ILI | = Influenza-Like Illness |
| OPD | = Outpatient Department |
| ICU | = Intensive Care Unit |
| FIA | = Fluorescent Immunoassay |
| LOS | = Length of Stay |
| CBA | = Childbearing Age |
| RIDT | = Rapid Influenza Diagnostic Test |
AUTHORS’ CONTRIBUTIONS
The authors contributed equally.
ETHICS APPROVAL AND CONSENT TO PARTICIPATE
The study was reviewed and approved by the IRB Institutional Research Board of IMC Hospital with approval number 2017-03-064, Jeddah, Saudi Arabia.
HUMAN AND ANIMAL RIGHTS
Not applicable.
CONSENT FOR PUBLICATION
The Research Institutional Board waived the need for consent for this retrospective descriptive study.
AVAILABILITY OF DATA AND MATERIALS
The data sets analyzed during the current study are available from the corresponding author upon request.
FUNDING
None.
CONFLICT OF INTEREST
The authors declare no conflict of interest, financial or otherwise.
ACKNOWLEDGEMENTS
The authors would like to thank Professor Ezzeldin Ibrahim, Dr. Shireen Alsherif, Dr. Noha Asem, Ms. Kholud Ebrahim, and Mr. Mohamed Janash for supporting this study.
REFERENCES
| [1] | Paul Glezen W, Schmier JK, Kuehn CM, Ryan KJ, Oxford J. The burden of influenza B: a structured literature review. Am J Public Health 2013; 103(3): e43-51. |
| [2] | Chi CY, Wang SM, Lin CC, et al. Clinical features of children infected with different strains of influenza B in southern Taiwan. Pediatr Infect Dis J 2008; 27(7): 640-5. |
| [3] | Irving SA, Patel DC, Kieke BA, et al. Comparison of clinical features and outcomes of medically attended influenza A and influenza B in a defined population over four seasons: 2004-2005 through 2007-2008. Influenza Other Respir Viruses 2012; 6(1): 37-43. |
| [4] | Paddock CD, Liu L, Denison AM, et al. Myocardial injury and bacterial pneumonia contribute to the pathogenesis of fatal influenza B virus infection. J Infect Dis 2012; 205(6): 895-905. |
| [5] | Kawai N, Ikematsu H, Iwaki N, et al. A comparison of the effectiveness of oseltamivir for the treatment of influenza A and influenza B: a Japanese multicenter study of the 2003-2004 and 2004-2005 influenza seasons. Clin Infect Dis 2006; 43(4): 439-44. |
| [6] | CDC INFLUENZA (FLU), seasonal flu, Peak month of flu activity. Centers for Disease Control and Prevention. Available at: https://www.cdc.gov/flu/about/season/flu-season.htm |
| [7] | Australian Department of Health and Ageing. Australian influenza report 2011.http://www.health.gov.au/internet/main/publishing.nsf/Content/cda-ozflu-2012.htm |
| [8] | Casalegno JS, Eibach D, Valette M, Enouf V, et al. Performance of influenza case definitions for influenza community surveillance: based on the French influenza surveillance network GROG. EuroSurveill 2009-2014; 22(14) |
| [9] | Ryu SW, Lee JH, Kim J, et al. Comparison of two new generation influenza rapid diagnostic tests with instrument-based digital readout systems for influenza virus detection. Br J Biomed Sci 2016; 73(3): 115-20. |
| [10] | Kammerer PE, Radin JM, Hawksworth AW, Myers CA, Brice GT. Performance of the Quidel Sofia rapid influenza diagnostic test during the 2012-2013 and 2013-2014 influenza seasons. Influenza Other Respir Viruses 2016; 10(3): 220-3. |
| [11] | Novak-Weekley SM, Marlowe EM, Poulter M, et al. Evaluation of the Cepheid Xpert Flu Assay for rapid identification and differentiation of influenza A, influenza A 2009 H1N1, and influenza B viruses. J Clin Microbiol 2012; 50(5): 1704-10. |
| [12] | Minodier L, Charrel RN, Ceccaldi P-E, et al. Prevalence of gastrointestinal symptoms in patients with influenza, clinical significance, and pathophysiology of human influenza viruses in faecal samples: what do we know? Virol J 2015; 12: 215. |
| [13] | Wie SH, So BH, Song JY, et al. A comparison of the clinical and epidemiological characteristics of adult patients with laboratory-confirmed influenza A or B during the 2011-2012 influenza season in Korea: a multi-center study. PLoS One 2013; 8(5)e62685 |
| [14] | Hong KW, Cheong HJ, Song JY, Noh JY, Yang TU, Kim WJ. Clinical manifestations of influenza A and B in children and adults at a tertiary hospital in Korea during the 2011-2012 season. Jpn J Infect Dis 2015; 68(1): 20-6. |
| [15] | Khan W, El Rifay AS, Malik M, Kayali G. Influenza Research in the Eastern Mediterranean Region: A Review. Oman Med J 2017; 32(5): 359-64. |
| [16] | Altayep KM, Ahmed HG, A Tallaa AT, Alzayed AS, Alshammari AJ, Ali Talla AT. Epidemiology and Clinical Complication Patterns of Influenza A (H1N1 Virus) in Northern Saudi Arabia. Infect Dis Rep 2017; 9(2): 6930. |
| [17] | Al-Tawfiq JA, Abed M, Saadeh BM, Ghandour J, Shaltaf M, Babiker MM. Pandemic influenza A (2009 H1N1) in hospitalized patients in a Saudi Arabian hospital: epidemiology and clinical comparison with H1N1-negative patients. J Infect Public Health 2011; 4(5-6): 228-34. |
| [18] | Mertz D, Kim TH, Johnstone J, et al. Populations at risk for severe or complicated influenza illness: systematic review and meta-analysis. BMJ 2013; 347: f5061. |
| [19] | Somerville LK, Basile K, Dwyer DE, Kok J. The impact of influenza virus infection in pregnancy. Future Microbiol 2018; 13: 263-74. |
| [20] | Almajhdi FN, Ali G. Report on influenza A and B viruses: their coinfection in a Saudi leukemia patient. BioMed Res Int 2013; 2013290609 |
| [21] | Falchi A, Arena C, Andreoletti L, et al. Dual infections by influenza A/H3N2 and B viruses and by influenza A/H3N2 and A/H1N1 viruses during winter 2007, Corsica Island, France. J Clin Virol 2008; 41(2): 148-51. |
| [22] | Goka E, Vallely P, Mutton K, Klapper P. Influenza A viruses dual and multiple infections with other respiratory viruses and risk of hospitalisation and mortality. Influenza Other Respir Viruses 2013; 7(6): 1079-87. |